How to Ace Data Interpretation in GRE?
Have you started your GRE preparations?
Are you having difficulty with the Quant section?
Do you want to know how to ace Data Interpretation in GRE?
If your answer to any of the above questions is ‘Yes’, then you’ve come to the right place! But to understand how to tackle Data Interpretation in GRE, we must first have a comprehensive idea of what it is in the first place.
What Is DI GRE?
Data Interpretation in GRE, or DI for short, is one of the 5 types of questions falling under the Quantitative syllabus. They require you to analyze and interpret data that is often in a pictorial form and subsequently answer questions based on them. This could be in the form of a table, a graph, or a chart and is followed by either multiple choice or numeric entry questions.
For example:
In which year was the imports to the exports of the company greater than 0.3 and less than 1.1? Indicate all such years.

While some questions on Data Interpretation in GRE are straightforward, others might be a little trickier – this is because it is also possible that you may be asked to determine if the diagram you’ve been given has enough information to answer the question (‘Not enough information’ is sometimes an option, and occasionally, the correct one)!
Why Is DI GRE Important?
DI is a crucial part of the Quant section on the GRE because it assesses a different set of skills. It tests your ability to understand, visualize, and extrapolate information; a skill that is of grave importance in Grad school, especially if you wish to enter the STEM stream.
Data Interpretation in GRE doesn’t require an understanding of some of the more academically complex math concepts that are needed to tackle other parts of the exam; rather it measures a more cognitive aspect of your profile. For instance, pictures speak a thousand words, and figures/graphs/charts, all allow you to understand what’s going on without the tediousness of reading a long passage. Graphs help you learn a lot of information in a shorter amount of time, but the chances of error also increases. There are no pre-learned formulas that you can apply, but rather have to rely on your wits to get it accurately. This is where the GRE exam measures your interpretation skills.
Thus, if you aspire to achieve a score of 160+ in the Quant section, then is important to spend enough time learning and practicing Data Interpretation in GRE. On average, you can expect a minimum of 4 to 5 questions in each Quant section.
This means that DI GRE carries a weightage of 20% in the Quant section!
Download our eBOOK to score 170 in Quants
Some Common Mistakes to Look for!
While attempting DI questions, we have noticed that most students tend to make similar kinds of errors. While there are only 4 or 5 DI questions per section, attempting them successfully is pivotal if you wish to achieve a score of 160+. We have made a list of the most common types of errors students are liable to make in DI:
- Misinterpreting data due to impatience or over-confidence
Remember how at the start we mentioned that Data Interpretation in GRE are really tricky? Well, this is why. More often than not, most students tend to get DI questions incorrect, not because they don’t know how to solve them, but rather, because they know how to solve them a little too well…
That’s right! Most students tend to see a DI question that may seem pretty simple at first glance and get carried away; not giving it a second thought. This is a mistake. Being overconfident and trying to solve such questions in a hurry in an attempt to perhaps save a precious few seconds can leave you vulnerable to errors. In DI GRE questions, the answer may not always be what meets the eye. So, take your time, reason out what the question asks and then attempt it.
- Time management
Speaking of saving a few precious seconds, misjudging the time is another type of error most students commit. While time-management isn’t strictly a DI-related error in GRE, it plays a significant role in it. As per our student data, these questions usually take a little longer to solve. This point is important to keep in mind so that you can equally balance your time in the Quant section.
- Lack of practice
Since these questions don’t test memory or any pre-learnt skills, but rather measure your interpretation and extrapolation abilities, they won’t come easy, especially to newcomers. Data Interpretation in GRE requires repeated practice to gain mastery. Practice makes perfect!
- Overlooking details
It is also pretty common for students to overlook certain details in the figure when faced with these types of questions. Because this question doesn’t offer any elaborate textual data but relies on your ability to understand and analyze the figure, it could be possible that students overlook minute details that might hold the key to finding the right answer.
Different Types of DI Questions
On the GRE, Data Interpretation questions can come in a plethora of forms.
If you wish to ace Data Interpretation in GRE questions, then it is imperative to understand the different types of questions that constitute this category, so that you can familiarize yourself with them. This will help you approach DIs with confidence on your test day!
There are 4 principal types:
- Pie Charts
- Column Charts
- Line Graphs
- Box and Scatter Plots
Pie Chart
The most popular, and perhaps also the easiest, pie charts are circular graphs divided into sectors; each of which holds some significant data that when put together form a whole. The sectors demonstrate percentages or proportions of a quantity that is demarcated in the question alongside.
The beauty of the pie charts is that they convey a lot of information easily. You must be able to then extrapolate the information from the chart to answer any question given to you. An example of a pie chart DI GRE question follows:
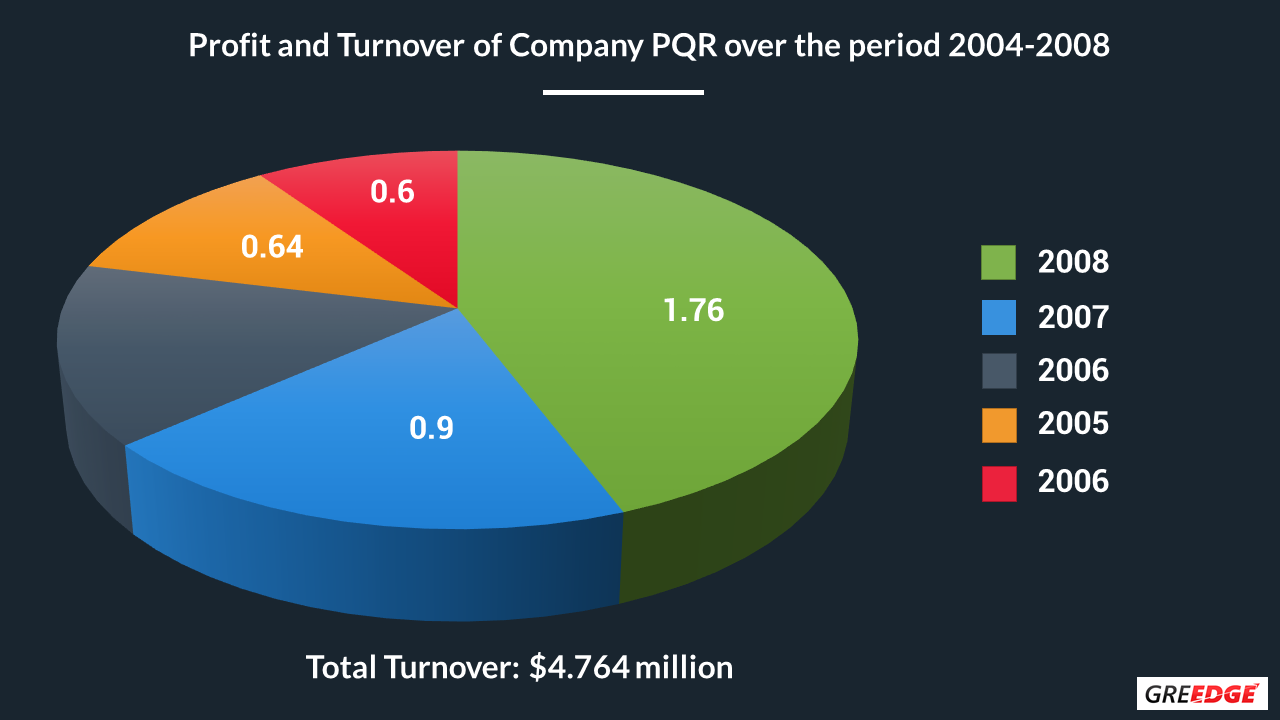
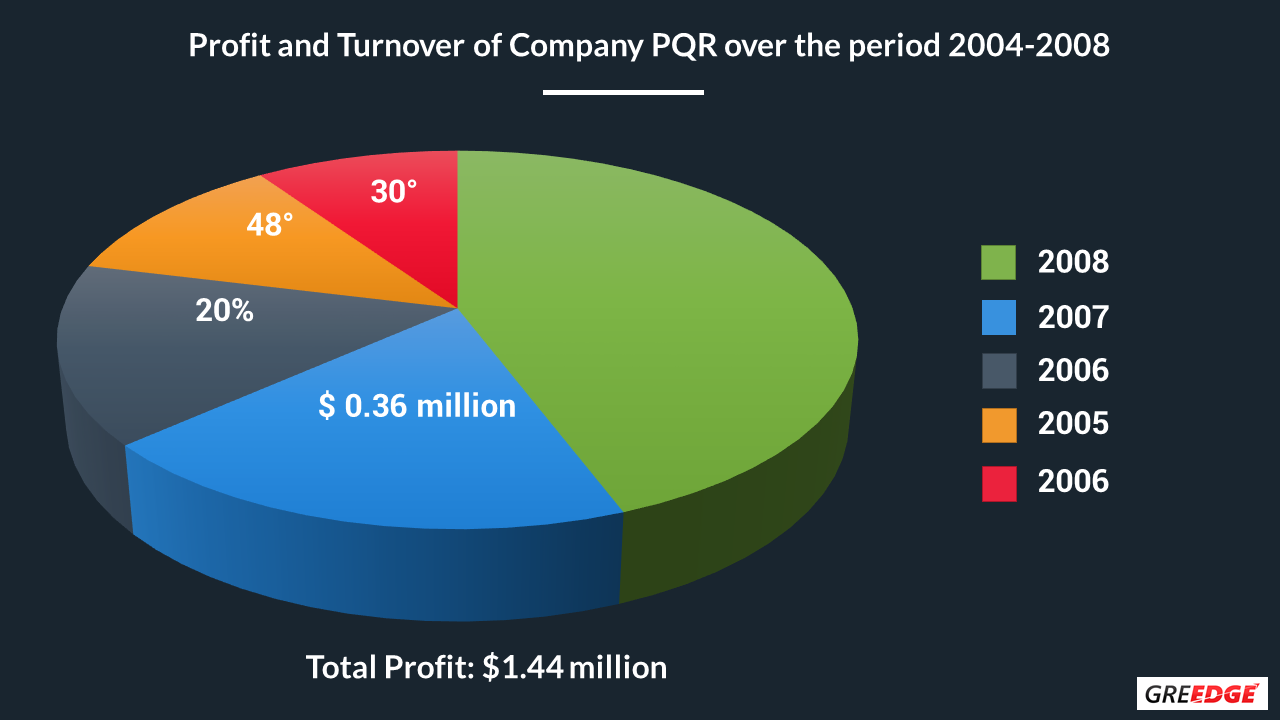
Q) If the turnover in the year 2008 is decreased by 15% and the ratio of the profit and operating cost remains the same, what will be the profit in the year 2008?
Note: Turnover – Operating Cost = Profit
- 0.48
- 0.408
- 1.28
- 1.088
Given data: Total turnover, Total profit, Ratio of profit & Operating costs are the same and Turnover – Operating Cost = Profit
Ans: The correct answer is Option B, 0.408.
Column Chart
Column charts are the second most common type of questions based on data interpretation in GRE. Also known as bar graphs, these figures showcase rectangles or ‘columns’ with varying lengths. These lengths highlight different data; that is, their measurements are proportional to the values they represent.
While most column charts are plotted vertically, don’t be surprised if they are presented to you in a horizontal fashion as well. The basic concept and premise remain the same: the length of the bars is proportional to their value!
An example is given below:
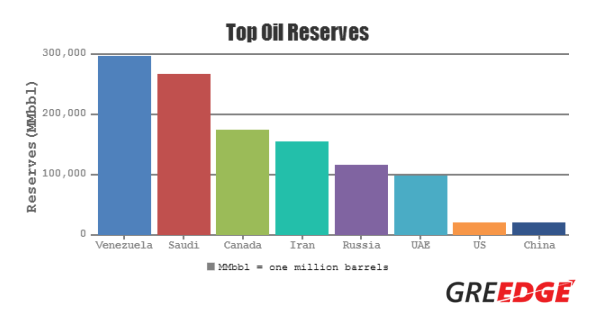
The column chart above represents a few countries and their respective oil reserves. An increase in the height (in this case) implies an increase in the value, and vice-versa. Therefore, we can extrapolate that Venezuela has the largest oil reserves in the world, pegged at just under 300,000 million barrels of oil. Conversely, the USA and China have the least with 20,000 barrels of oil each.
However, your DI GRE questions won’t always be this straightforward. You should be able to investigate deeper into this chart. For instance, with the help of the data given along Y-axis, you can also quantify the differences between countries in terms of ratios. Since China has 20,000 barrels of oil, you can say that UAE (with exact 100,000 barrels) has approximately 5 times as much oil as China, or that the ratio of their oil reserves is 5:1.
Similarly, the ratio between Venezuela and Iran is at approximately 2:1, and so on. Keep in mind that DI in GRE will often feature questions related to ratios, proportions, and percentages; especially with bar graphs of quantifiable lengths.
Line Graphs
Another type of DI GRE question that is bound to come at least a few times in your exam is line charts. You must have already seen these types of graphs feature on TVs and newspapers often. This is because they are the most common type of chart used to compare progress between two or more quantities.
For example, the GDP growth rates of two countries over time can be plotted using line graphs, or the performance of two stocks over the last quarter.
So, what is a line graph? A line graph demonstrates information in the form of a series of data points which are connected by a straight line called the trendline.
The most significant aspect to understand this type of data is that line graphs help you understand movement or growth!
Look at the example below:
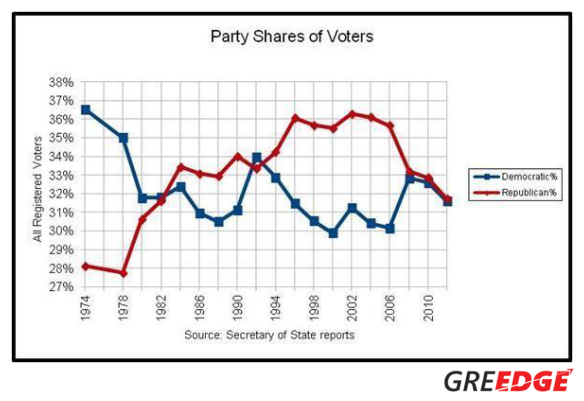
The picture above illustrates what a common line graph looks like. On the Y-axis you find the data of all registered voters, while on the X-axis you are given the data of each 4-year term through the secretary of state reports. But that’s not all. You will also see two other pieces of information; namely, the data points of the Republicans as well as Democrats.
Line graphs can thus be tricky!
Here, in this example, we potentially see 4 different data sources. Having to deduce from the given graph could sometimes become unnerving and time-consuming, so it’s important to maintain your focus. From graphs like these, you will be asked questions along the lines of these: Which year saw the maximum percentage change in the share of voters for the Democratic party? Or, what is the average percentage share of the voters for the Republican party from 1980 to 2010?
Box and Scatter Plots
And last but not least is the box and scatter plot graphs. Now, while such graphs are only occasionally given on the GRE, it is our duty to stay prepared for any such contingencies.
A scatter plot is a way of displaying bivariate data. This means that it examines two separate variables for a common subject or set of subjects. A simple example of a scatter plot is a relationship between two variables such as age and weight of several people and plotting the data on the same graph. Another example could be the relationship between their annual income and the number of kids.
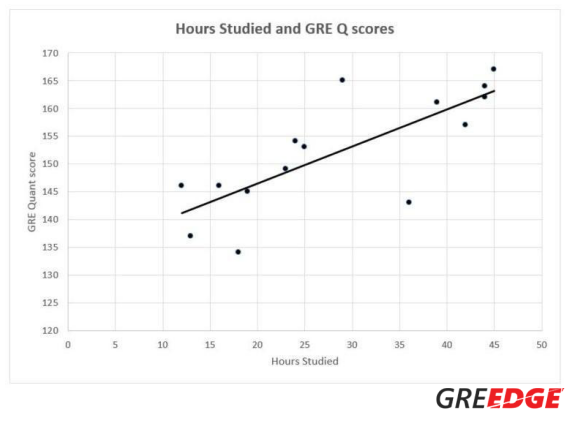
As shown in the scatter plot above, the number of hours studied by students is pitted in correspondence against their GRE Quant score. Now, based on this graph you could be asked to extrapolate information such as: Who scored score the highest in their GRE Quant section among those who studied for less than 30 hours?
All GRE questions may not be this simple as the once we looked at above, but the manner in which they come will be similar. Acquainting yourself with these DI GRE questions will allow you to approach them with far more confidence.
Moreover, according to data from our students, DI GRE questions usually take up more time and mental power than other categories. Since there are 20 questions in each Quant section and you are allotted only 35 minutes per section, you cannot afford to spend more than 2 minutes per question on data interpretation in GRE.
Tick Tock!
Within 2 minutes, you will need to assimilate information, interpret this correctly, and accurately answer the questions that follow. If you are not familiar with reading data, then it can quickly turn out to be a daunting task…
So, how do you pick out the relevant information and work it out in 2 minutes?
Tips to Ace Data Interpretation in GRE
Here are some special tips and tricks to help you ace the DI GRE!
- Develop a Strong Conceptual Understanding
- The Art of Being Approximately Accurate
- Watch Out for Keywords
- Two is Better than One
- Develop a Strong Conceptual Understanding
As mentioned above, DI GRE isn’t a test of your memory or rote-learning skills, but rather, it is a measure of your understanding and extrapolating abilities. It examines how well you have understood and internalized the concepts you are taught, rather than testing your ability to recall certain formulae.
Thus, it is important to be well-prepared and thoroughly clear in your notions regarding topics, such as:
- Fractions
- Decimals
- Percentages & Ratio
- Statistics
- Probability
Building a strong conceptual base especially in these topics ensures that you proceed with the correct methods, despite traps in the question.
- The Art of Being Approximately Accurate
We have spoken at length about how DI GRE questions can sometimes cost you more time than its counterparts. Thus, this technique will help you limit the time you spend on such questions, without the cost of losing out on accuracy.
Firstly, it is important to understand that the GRE is designed to test your presence of mind! This means that you will encounter some challenging numbers and calculations. But it’s possible that this perception can also work against you sometimes.
Unless a question has multiple steps, we suggest that you round off your values and proceed with your calculations. If your answer is closest to any of the options, mark it and move on! This will save you time as well as unnecessary effort.
However, beware! Don’t use this tip if the answer choices are too close to one another. They could be traps. This is a trick that works often, but not always. Your forethought is required before you choose to mark an answer.
- Watch Out for Keywords
Another DI GRE hack is utilizing keywords. Read the question carefully and understand clearly what you’ve been asked to answer. What the creators of the GRE love doing is presenting you with two correct answer choices, but to two different questions!
They do this by presenting you with excess data; useless information to bait you into including that in your calculations. The final value of this calculation will then be given as one of your answer choices. While your calculations may be correct, you would have been lured into getting the answer for the wrong question.
This is once again to test your focus and presence of mind. If you haven’t read the question – the actual question – correctly because you were in a time crunch, or simply overconfident, then you will end up choosing the wrong answer and hence lose out on the score in a silly manner.
Common things to look for are units of measurement in the axes, decimal points, and other such smaller details in the fineprint.
- Two is Better than One
Interpreting data quickly is a skill that comes with practice. You need to cultivate it, just as you would hone any other talent. Make sure you practice different kinds of charts and questions. This will help you overcome most of the problems mentioned above. And since DI GRE is a sure-shot question carrying 20% of the Quant section weightage, it pays to perfect your techniques.
A recommendation from us would be to practice questions with more than one type of chart, requiring you to correlate data. This will help you understand the relationships between different types of information and the variables connecting them better.
Additionally, and perhaps luckily for you, DI GRE questions don’t usually reflect the same level of difficulty as questions from other categories, such as Algebra or Arithmetic for example. That is to say, GRE understands the nature of such questions and therefore doesn’t set the difficulty of these too high. If you make yourself aware of the strategies needed to address such questions, then you should be in a safe spot.
Before we leave you, here are some pro-tips from our Quant SFAs to keep in mind:
Keep in Mind
- The questions are to be answered only on the basis of the data presented, everyday facts (such as the number of days in a year) and your knowledge of mathematics. Do not make use of specialized information you may recall from other sources about the particular context in which the questions are based, unless the information can be derived from the data presented.
- Think beyond formulae: understand the concept, don’t just take the formula approach
- Solve a lot of questions so that on the exam day you get that “Oh I have done this before!” feeling for most of the questions.
- Understand when to skip a question for the greater good of your test. Look at the bigger picture. If you feel like you are spending too much time on any particular question, skip it and finish the rest of the section – you can always come back to the unfinished question later.
- Questions are relatively easy, but tricky. You need to pay attention to the language, or how it is worded.
- Spend only 15 to 30 seconds analyzing the graph and jotting down key information. Then, proceed with your calculations. Remember, you only have 2 minutes for each question.
- And lastly, there is no negative marking on the GRE. If you find yourself absolutely stuck for any reason, make an intelligent guess, but make sure you answer. You may be lucky! You miss 100% of the shots that you don’t take.
This is a comprehensive article on how to ace the Data Interpretation questions on the GRE. Follow these tricks, and you are bound to ace it!