
Top 5 tips to crack GRE Data Interpretation Questions
The section in GRE Quantitative syllabus includes a broad list of topics such as:
- Algebra
- Arithmetic
- Geometry
- Applied Mathematics
- Data Interpretation
For most engineers, after doing more complex mathematics for four years, questions based on the concepts of algebra or arithmetic are easier to tackle compared to Data Interpretation or Geometry. This is simply because they are out of practice.
But why should you focus on Data Interpretation particularly?
If you aim to hit a 160+ in Quant, then is important to spend enough time learning and practicing Data Interpretation because a minimum of 4 or 5 questions can be expected in each Quant section. This means that DI carries a 20% weightage in the Quant section.
Makes it pretty important to get right to a high score, don’t you think?
Structure of a GRE Data Interpretation Question:
In a DI question, you will face one form of pictorial data such as a bar chart (either horizontal or vertical), pie charts, line graphs or tables, followed by 3 or 4 questions on the same. The question types could be multiple-choice or numeric entry types.
Throughout this post, you’ll see all the different types of examples!
For example,
The line graph shows the ratio of imports by a company to the number of exports from that company over the period 2000–2006.
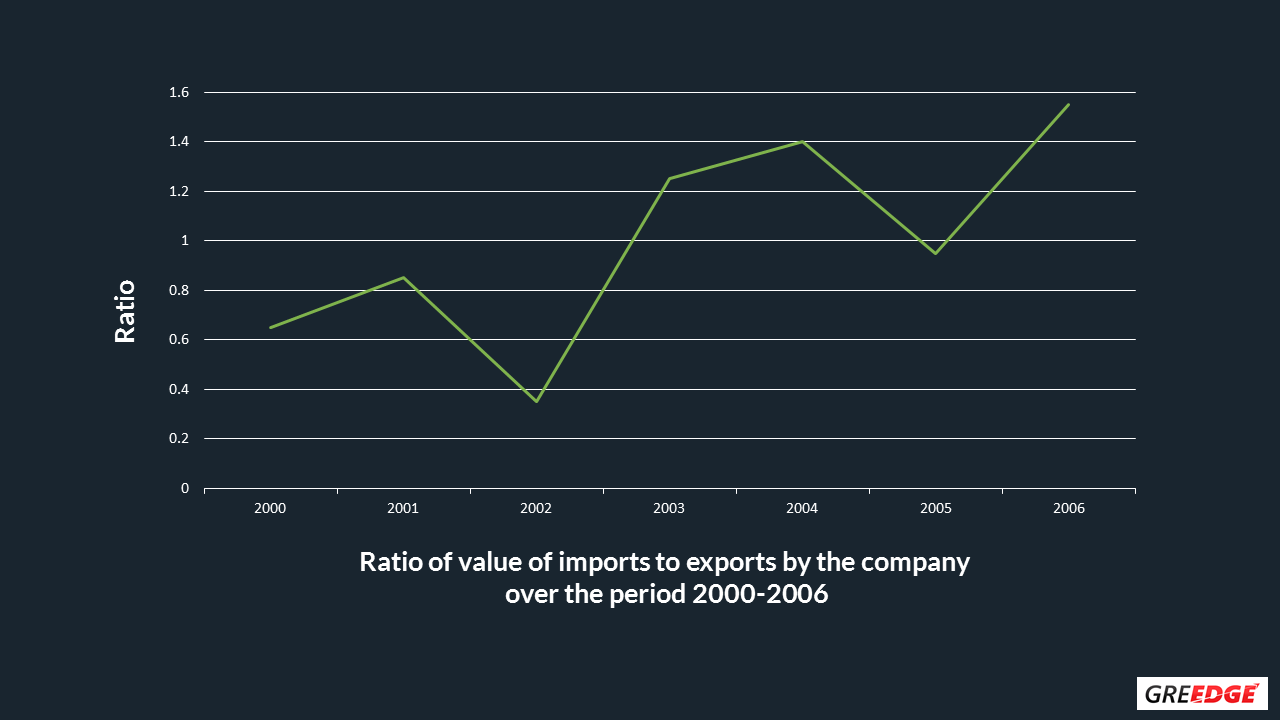
Q. In which year, was the imports to the exports of the company greater than 0.3 and less than 1.1?
Indicate all such years.
Choices:
- 2000
- 2001
- 2002
- 2003
- 2004
- 2005
- 2006
Ans: The correct answers are options A, B, C, and F
From the graph,
Ratio of value of imports to exports in 2000 = 0.65
In 2001, ratio of value of imports to exports = 0.85
In 2002, ratio of value of imports to exports = 0.35
In 2003, ratio of value of imports to exports = 1.25
In 2004, ratio of value of imports to exports = 1.4
In 2005, ratio of value of imports to exports = 0.95
In 2006, ratio of value of imports to exports = 1.55
The correct answers are A, B, C, and F
How can you master Data Interpretation? Learn how in just a few key steps, through an ebook that’ll make you an expert! Download your FREE eBook now!
Some common GRE Data Interpretation mistakes to look out for:
- Misinterpreting data due to impatience/over-confidence
- Time management
- Lack of practice
- Overlooking details
Since there are 20 questions in each Quant section and you have only 35 minutes per section, you cannot spend more than 2 minutes on any of the questions.
So, within 2 minutes you need to assimilate data, interpret it correctly, and answer questions that follow. This can be quite a task if you are not familiar with reading data.
So, how do you pick out the relevant information and do it for 2 minutes?
How to Approach a GRE Data Interpretation Question:
First, don’t be alarmed when you see data that apparently seems complicated. There is a method to the madness.
There are important techniques that you can follow that will help you figure out the right answers.
#Tip 1: Look for tell-tale signs:
Your graph may look complicated but there are some key points that you should note down as soon as you see a graph, like the axes of the graph, the units of measurement, and the title of the graph. It is important to pay attention to the title because you will be able to pick out crucial facts like what the data represents.
For example,
Annual Percent Change in the Dollar Amount of Sales at Five Retail Stores from 2006 to 2008
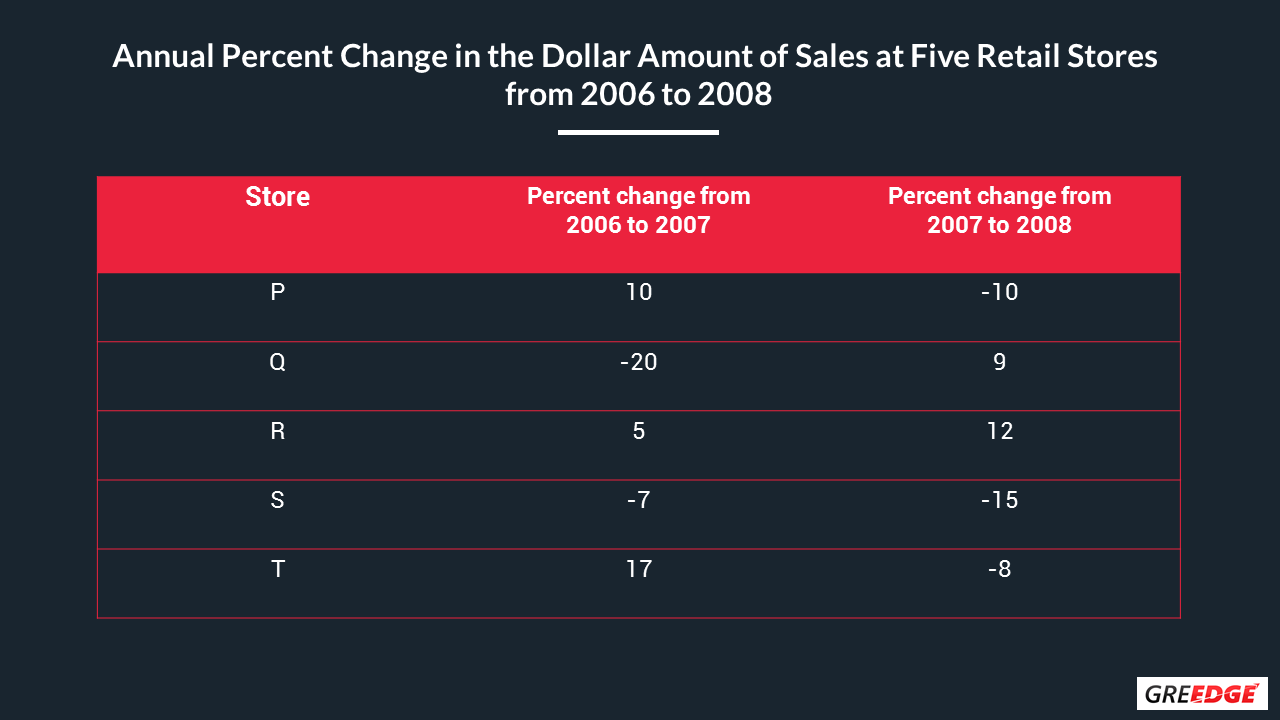
Q. At Store P, if the dollar amount of sales was $800,000 for 2006, what was the dollar amount of sales for 2008?
- $727,200
- $792,000
- $800,000
- $880,000
- $968,000
Ans: The correct answer is Option B, $792,000.
Explanation from our SFAs:
Since it is mentioned that the sales of Store P was $800,000 in 2006, we can use that to calculate the respective rise in percentages for 2007 and 2008.
According to the figure, the percentage increase for 2007 is 10%. So, we will calculate it as 110% of the base amount, which is, 110% of $800,000 = $880,000.
Similarly for 2008, the percentage decrease is 10%. The calculation is 90% of $880,000 = $792,000.
AdmitEDGE Pro Tip: Always ensure you check the base amounts before doing calculations like these. A percentage increase of 10% in 2007 followed by a percentage decrease in 2008 does not mean the answer is the same as the initial amount because the base amounts for 2007 and 2008 are different.
Thus, “Annual percent change in the dollar amount of sales at five retail stores from 2006 to 2008” tells us that the data represents “percent change” rather than absolute percentages.
Looking for a study plan for your GRE preparation? Check out Achyuth’s 30-day study plan to a top GRE Score! Download Achyuth’s FREE 30 Day Study Plan now!
#Tip 2: The Art of Being Approximately Accurate:
The GRE is meant to test your presence of mind apart from your reasoning skills. This means that you will encounter some challenging numbers and calculations. Before you jump to the online calculator and start crunching numbers, wait! Round up decimals and approximate to the nearest whole numbers so that you know the ballpark figure. For example, 27% of 153,000 could be rounded off to 25% of 150,000 so that you can eliminate far-fetched options.
AdmitEDGE Pro Tip: Beware and use this sparingly. If the answer choices are pretty close to one another, it is best to skip this step and directly calculate your answer. If your range includes two options then it makes it necessary to actually calculate the answer causing you to waste more time.
#Tip 3: Say What?
I cannot emphasize this enough because this is one of the common reasons behind students scoring a 165+ but not a 170. Read the question carefully and understand clearly what you’ve been asked to answer. Many times, the answer choices have two right answers but to two different questions. If you haven’t read the question correctly because you were in a time crunch, you will choose the other answer and hence lose out.
For example,
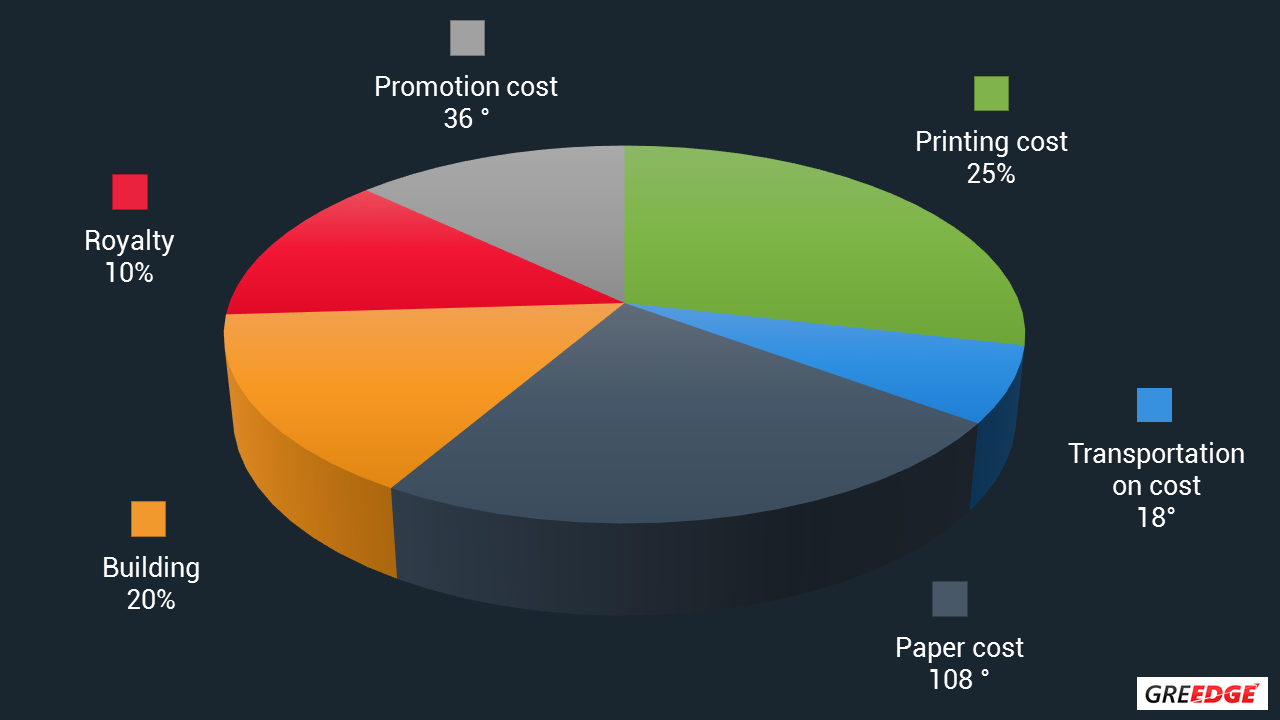
Q. If 3000 copies of a book are published and the paper cost on them amounts to $ 9000, what should be the selling price of a book so that the publisher can earn a profit of 25%?
Choices:
- $ 3.4
- $ 12.5
- $ 37, 500
- $ 10
- $ 2.5
Ans: The correct answer is Option B, $12.5.
Explanation from our SFAs:
Let the SP of 3000 books be $ X.
To earn a profit of 25%, SP = CP + 25% of CP = 125% of CP
From the given pie-chart,
paper cost = 30% of CP
$ 9000 = 30/100 * CP
CP = 9000 × 100 / 30 = $ 30,000
SP = 125% of $ 30,000
= 125 / 100 × 30,000
= $ 37,500
Therefore, SP of one book = 37500 / 3000 = $ 12.5
For a pie-chart question, bear in mind that the whole pie is split into parts of a whole either using percentages or degrees.
The following conversion can be used to calculate the value of the sector based on what is given in the pie-chart.
Value of the sector = (Percentage / 100) * Total value
Value of the sector = (Central angle of the sector / 360)* Total value
For this question, after a quick scan, if you assumed the “paper cost” to be 108%, then you would choose the first option i.e., $ 3.4, which is incorrect.
Confused about the different questions in GRE Quant? We’ve made it super simple and easy! Get your guide to the different types of GRE Quant Questions you can expect! Download your FREE guide now!
#Tip 4: Develop an Eagle Eye for Charts:
Interpreting data quickly is a skill that comes with practice. Make sure you practice different kinds of charts and questions. This will help you overcome most of the problems mentioned above. And since DI is a sure-shot question, it pays to perfect your techniques.
AdmitEDGE Pro Tip: Practice questions where there is more than one type of chart and you have to correlate data. This will help you understand the relationships between different types of data and the variables connecting them. This helps you understand data analysis as a whole.
For example, Profit and Turnover of Company PQR Over the Period 2004-2008
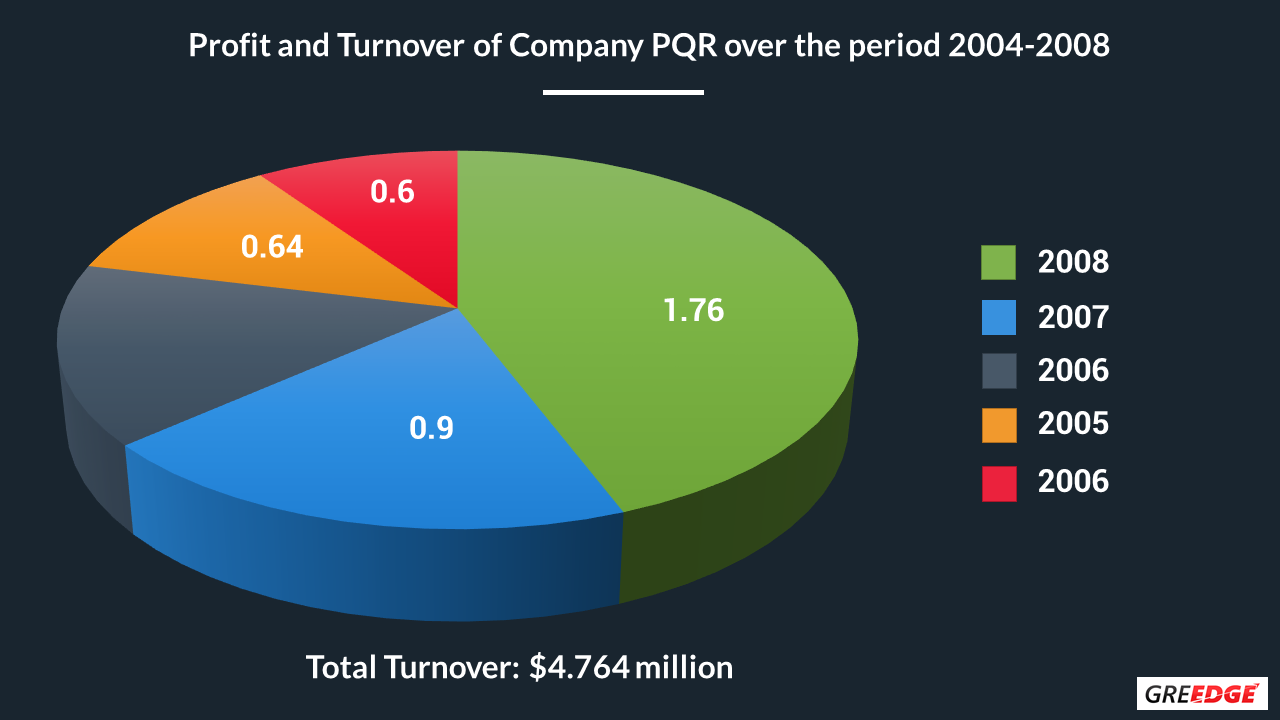
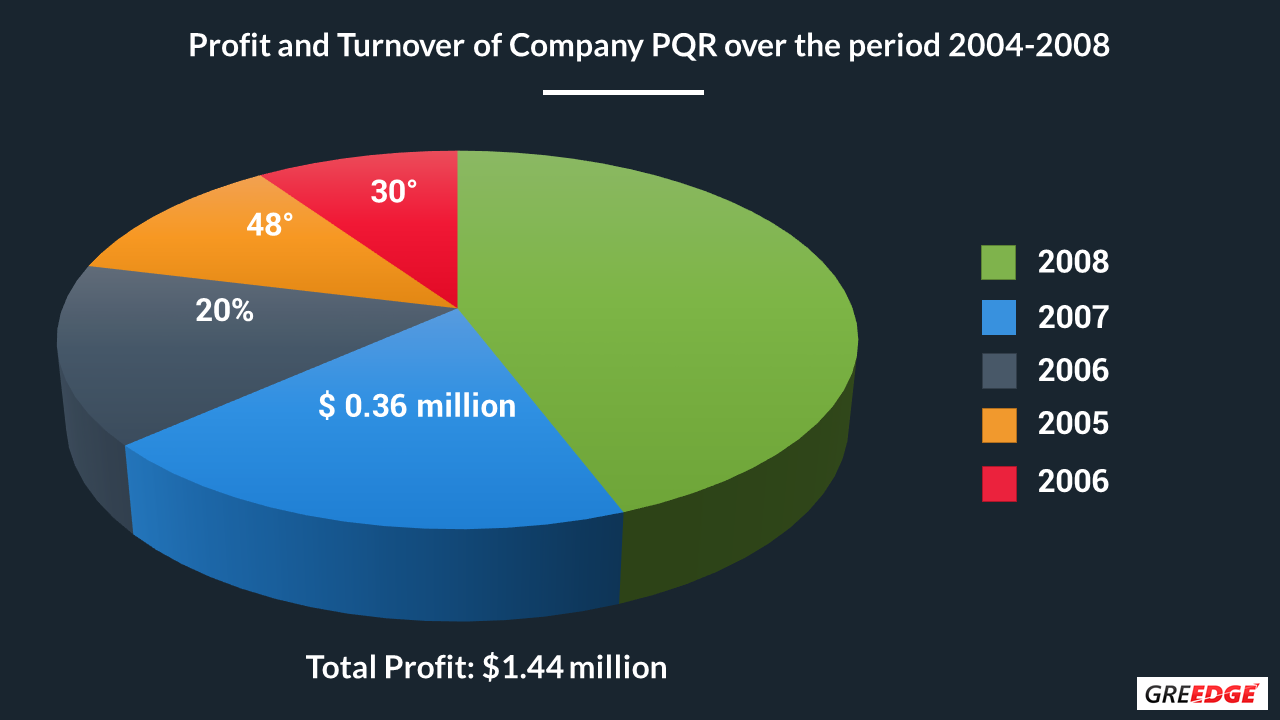
Q. If the turnover in the year 2008 is decreased by 15% and the ratio of the profit and operating cost remains the same, what will be the profit in the year 2008?
Note: Turnover – Operating Cost = Profit
- 0.48
- 0.408
- 1.28
- 1.088
Ans: The correct answer is Option B, 0.408.
Explanation from our SFAs:
Given data: Total turnover, Total profit, Ratio of profit & Operating cost are the same & Turnover – Operating cost = Profit
Total profit = Profit in (2004 + 2005 + 2006 + 2007 + 2008)
$1.44 million = $0.36 million + $0.288 million + $ 0.192 million + $0.12 million + Profit in 2008
Therefore, profit in 2008 [P(2008)] = $ 0.48 million ———-> (1)
But, Turnover in 2008 = 1.76
Operation cost of year 2008 [OC(2008)] = Turnover – Profit = 1.76 – 0.48 = 1.28 ——> (2)
Therefore, P(2008) / OC(2008) = 0.48 / 1.28 ———–> (3)
Given that, turnover in the year 2008 is decreased by 15%.
So, the New turnover = 1.76 – (15% * 1.76) = 1.76 * 0.85 = 1.496 —–> (4)
Now, if the new profit and operating cost are P1 & OC1 respectively, then according to the question,
P(2008) / OC(2008) = P1 / OC1
Therefore, P(2008) / OC(2008) = P1 / OC1 = 0.48 / 1.28
Since, we have to calculate profit, OC1 = P1 * (1.28 / 0.48) = P1 * 2.67 —–> (5)
Operating cost = Turnover – Profit
Therefore, New turnover = P1 + OC1
1.496 = P1 + P1*2.67 = P1 * 3.67
Therefore, P1 = 1.496/3.67 = 0.408
Want to predict your GRE score? Understand exactly what score you can get, with a mock GRE Scoretest Test your GRE readiness now!
#Tip 5: Befriend the Pen & Paper:
When you are practicing DI questions, always use a pen and paper to jot down the important points mentioned in the question as well as minimum and maximum values, reference values based on which the graph is drawn, etc. With time, you will become accustomed to picking out these values as soon as you see a graph.!
To summarize, these are some of the points to remember:
- Spend only 15 to 30 seconds analyzing the graph and jotting down key information. Don’t spend more than 2 minutes per question.
- The answer is literally staring at you in the face in the graph. So, don’t feel disheartened. Mark it for verification and get back to it, if you are unsure of the answer.
- There is no negative marking in GRE. Approximate and make an intelligent guess, but make sure you answer. You may be lucky!
- The devil is in the details. Make sure you pay attention to the axes, the units asked the question, concepts used like percent changes or sector to percentage conversion etc.
- Try to practice as many questions as you can so that you feel, “Oh, I’ve seen this kind of question before,” during the exam!
Comment and let us know how we can help you with your Quant difficulties!
Ever wanted a topper’s notes? Especially, someone who got a 330 in GRE? You can get Soarabh’s personal Quant GRE notes to make your preparation easier! Get 330 Scorer’s handwritten Quant notes now


Hi Shruti Maam!
Thanks for the great tips!
Can you help me understand the difference between GMAT DI section & GRE DI section?
Hi Divakar,
Thank you!
That’s a very good question! The main difference between GMAT and GRE Quantitative Reasoning is that the Math in GMAT is harder than GRE because GRE is section wise adaptive while GMAT is question wise adaptive – this means that the questions get harder as you answer them correctly and also harder questions have higher points than easier ones. Whereas, in GRE it is section wise adaptive, therefore all questions have the same weightage and are of similar difficulty levels within the section.
For more understanding about GRE and GMAT, please read here : https://www.greedge.com/blog/gre-vs-gmat-which-one-should-i-go-for/
Good Luck!